Public Markets Map
Company: Secretaría de Desarrollo Económico de la CDMX
Role: Technology Advisor and Head of Technology
Stack: React, TypeScript, Tailwind CSS, FastAPI, PostgreSQL
Public Markets Map
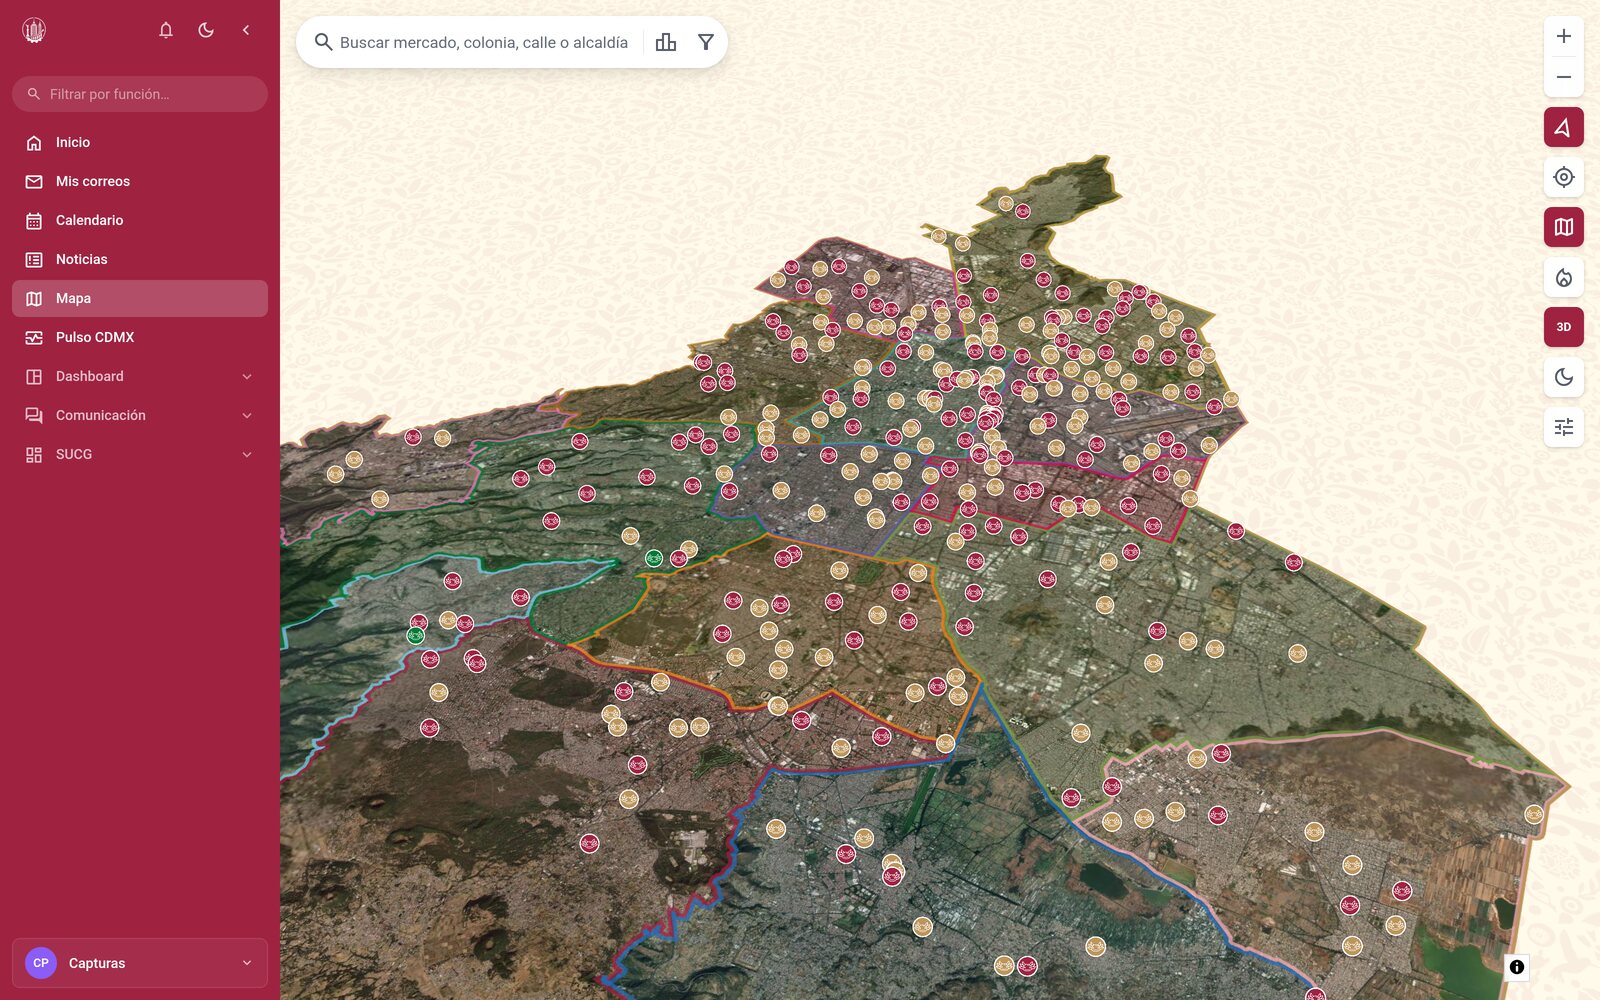
Mexico City's 340 public markets on a single map: where each one is, what shape it is in, what it needs, and which ones to tackle first.
What it solves
The market registry lived in spreadsheets: one per department, each with its own version of the truth and none with a location. Finding out which market was in the worst shape meant merging four files and trusting they all meant the same building.
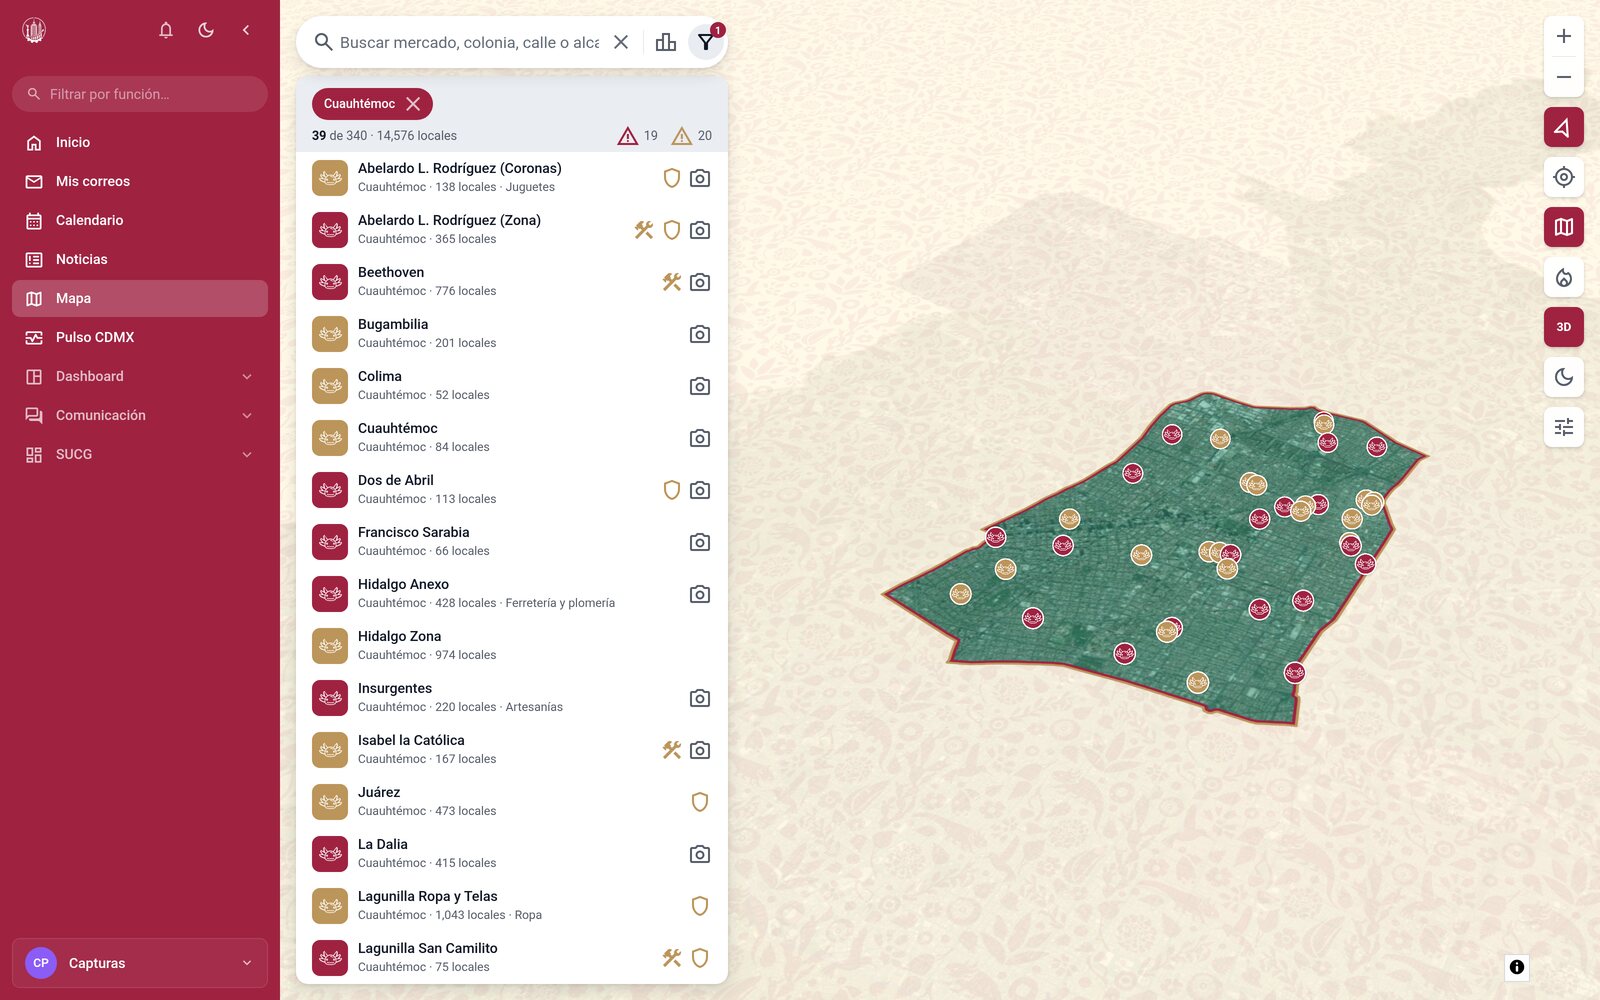
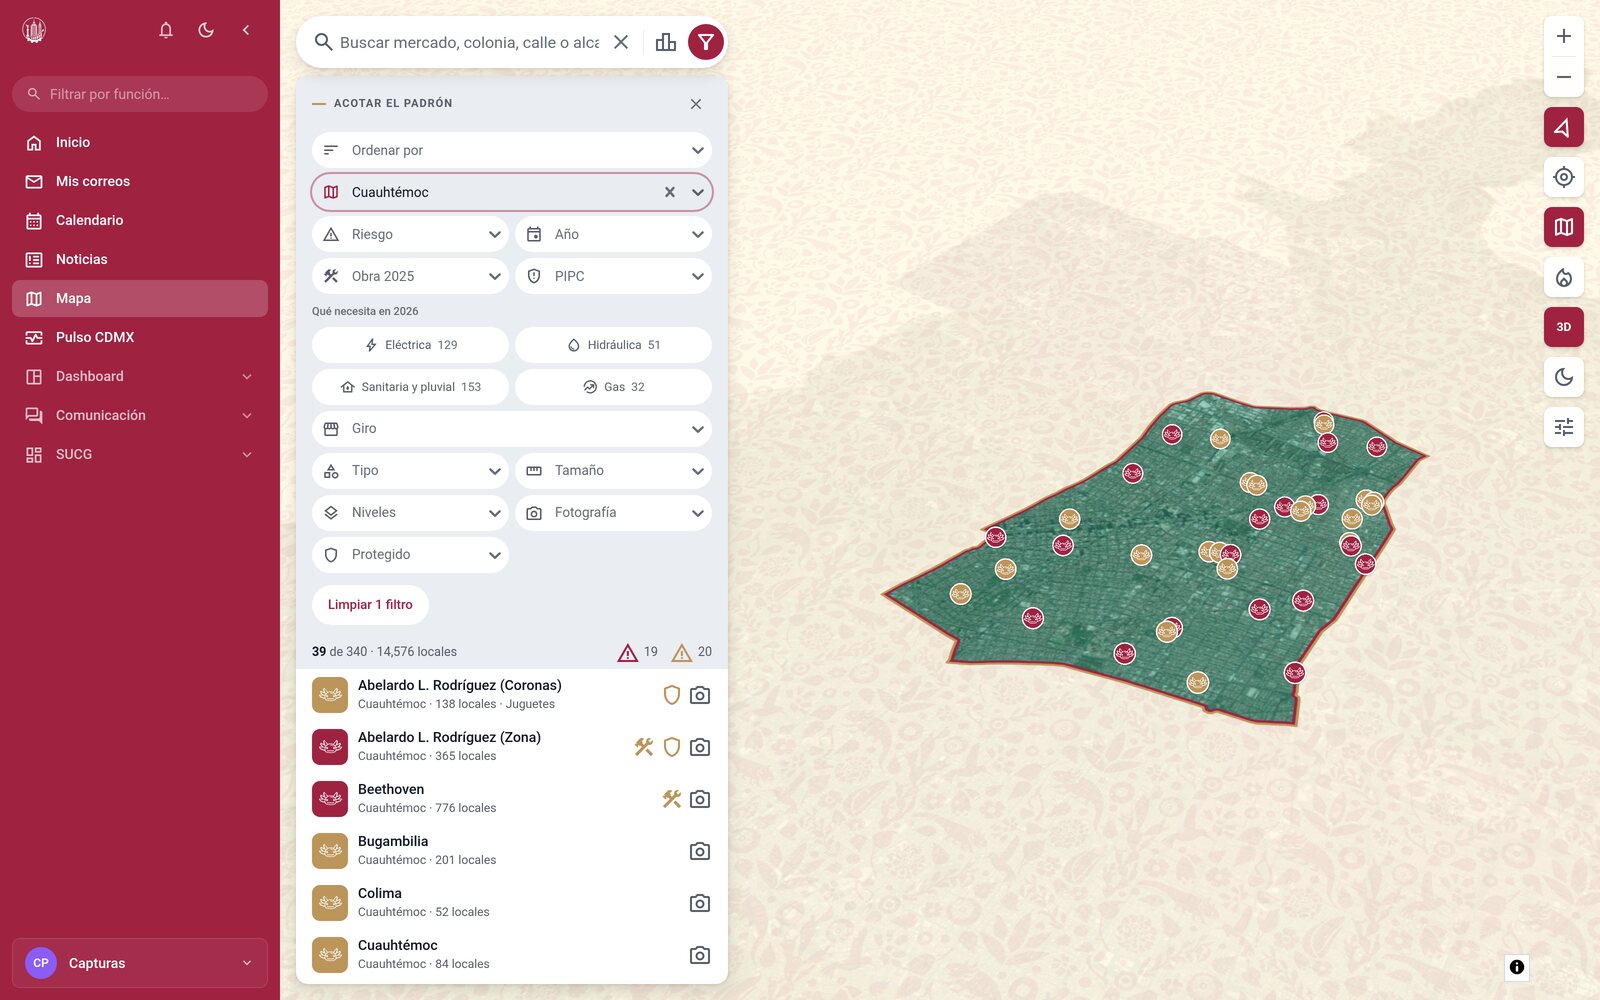
Now it is one database and one map. Narrow it down by borough, risk level, what it needs, or whether it already had work done — and what's left shows up on the city right away.
Where to start
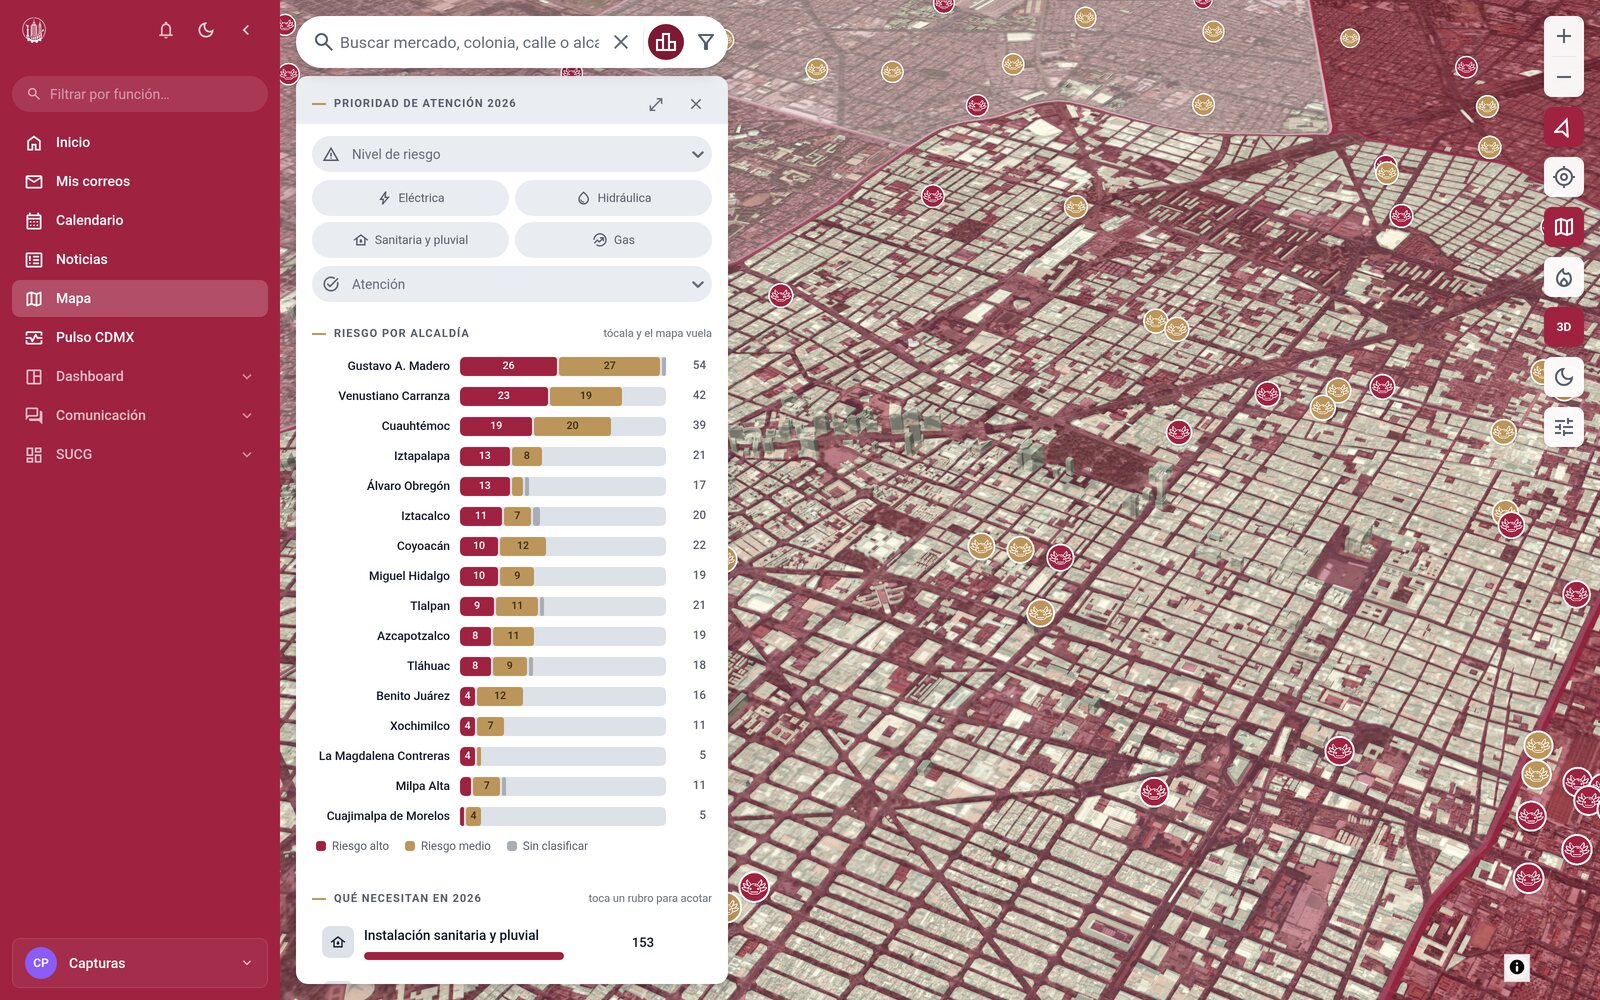
The priority view ranks all 16 boroughs by markets at risk and breaks down what is needed — electrical, plumbing, sewage, gas. It is the screen where the year's work gets decided.
The map is 3D, and that matters
Satellite imagery, building volumes and the valley's relief. Not decoration: a market is recognized by its roof and the block it takes up, so anyone who knows it can place it without reading the address.
::carousel images=[{"src": "/media/work-projects/images/mercados-cdmx/edificios.jpg", "alt": "3D view of downtown", "caption": "Downtown in volume, with the markets pinned"}, {"src": "/media/work-projects/images/mercados-cdmx/reforma.jpg", "alt": "Reforma in 3D", "caption": "Reforma: satellite, buildings and the registry on top"}, {"src": "/media/work-projects/images/mercados-cdmx/zocalo.jpg", "alt": "The historic center", "caption": "The historic center seen from the map"}]::
Each market's profile
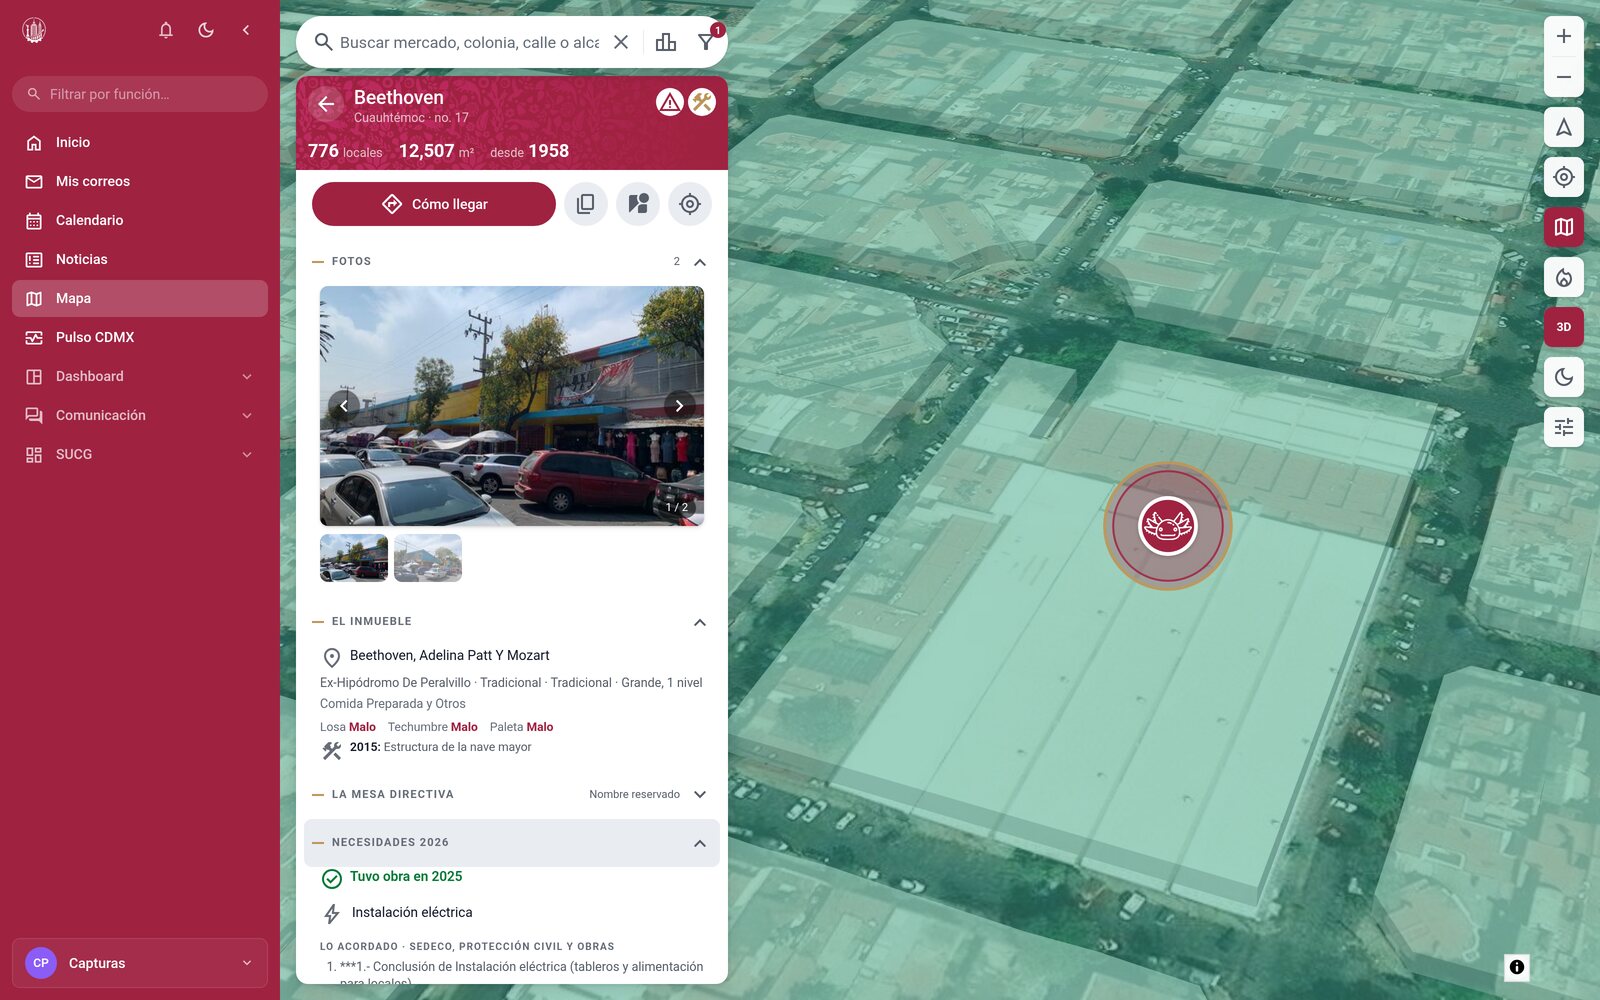
Stalls, surface, year built, photos, the state of the building, what it needs and what was agreed to be done. Everything that used to take emails to three different departments.
::two-columns split="50-50"::
What I did
The whole map, the registry and its profile view, the filters and the priority view. Frontend and backend.
::column-break::
What mattered
That it help decide, not just consult. A registry you only look at changes nothing; this one filters, sorts by risk and ends in a list of who is next.
::/two-columns::
Stack
React with TypeScript and MapLibre over vector tiles, against a FastAPI and PostgreSQL backend. Restricted data isn't hidden in the UI: the permission is checked on the server, and what you're not cleared for never leaves it.